Testing (microDiagnostics)#
Applet Test#
To start the applet test:
- Select the board you want to test.
- Start the applet test by selecting Diagnosis -> Applets.
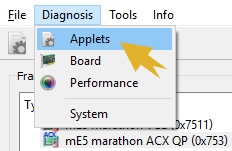
marathon Frame Grabbers#
On marathon frame grabbers, only the applet that has been set as active applet is tested. All other applets on the board are skipped.
The results are displayed in the lower window pane immediately:

To test another applet, you first need to set it active:
-
From the menu, select Tools -> Manage Firmware/Applet(s).
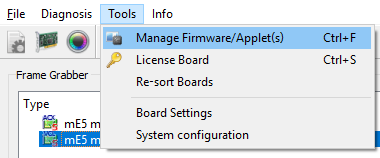
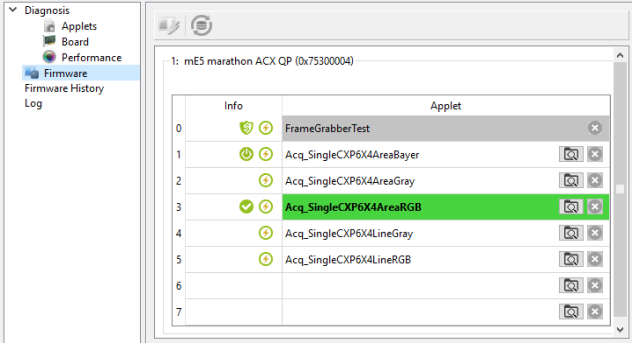
All applets flashed onto the board are listed. The applet currently active on the board is marked by a small tick on green background:
-
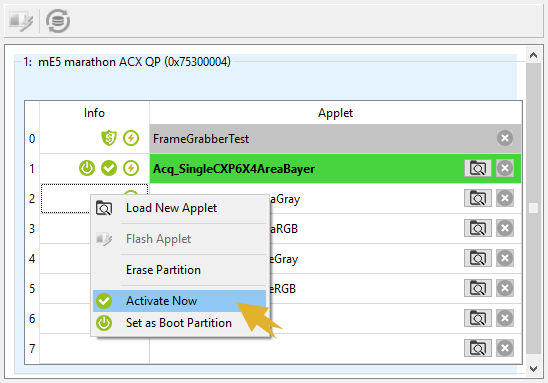
Right-click on the line that lists the applet you want to test.
-
From the context menu, select Activate Now.
-
Follow the instructions on the screen.
For more details on setting an applet active, see Managing Applets. - Restart the applet test (see above) to test the new applet.
Board Test#
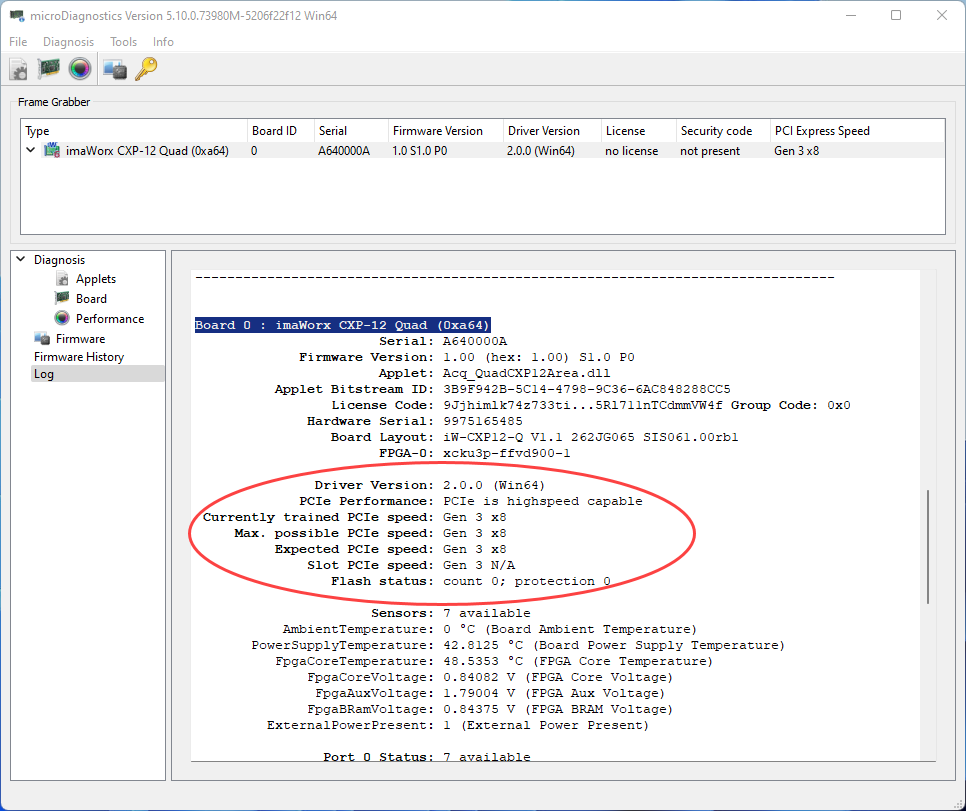
You can carry out a board test using the tool microDiagnostics. With the board test, you can check the overall functionality of a frame grabber. The board test entails the performance test which you can also start separately.
To start the board test:
- Open microDiagnostics (
<Framegrabber SDK installation directory>/bin/microDiagnostics.exe). - Select the board you want to test.
If the frame grabber board you want to test isn't listed, update the device driver for the board. - Start the board test by selecting Diagnosis -> Board.
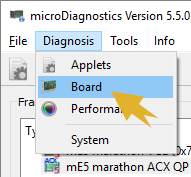
The results are displayed in the lower Window pane immediately:

If you encounter problems running tests, compare the Framegrabber SDK requirements for firmware and device driver with your installation.
To run tests in microDiagnostics, the firmware on the frame grabber and the device driver installed on your system must match the requirements of the Framegrabber SDK version you are using.
To solve the problem, check the release notes of your Framegrabber SDK version for firmware and driver requirements.
Which firmware is available on your frame grabber, and which device driver is installed on your system you can see in the frame grabber listing in the upper program pane of microDiagnostics:

If the versions don't match, flash your frame grabber with a new firmware or update your device driver.
By default, the correct matching device driver version is installed on your system together with the Framegrabber SDK.
Logging#
You can check the log file containing the data of all your tests:
microDiagnostics is logging all activities carried out during one session (instantiation). As you work with the program, all activities are continuously logged to file. When you close microDiagnostics, the log file is discarded.
To get information out of the log file:
- Select category Log from the left-hand panel.
- Use the scroll bar to scroll the log file up and down.
Info
The board test is carrying out various tests at once. You can always re-start an individual test by clicking on the Play icon in the Control column.

Alternatively, you can re-start an individual test in loop mode by clicking on the Loop icon in the Control column. To stop the loop, click the Stop lcon in the Control column.
Performance Test#
To get detailed information about the actual bandwidth for your frame grabber:
- Open microDiagnostics.
- Select a board in the left upper corner.
- From the menu, select Diagnosis -> Performance.
The performance test gets started. The test is carried out for the applet that is the currently active applet on the frame grabber.
The results of the performance test are displayed. You see the actual transfer rates for example image sizes (on the X axis, the image dimensions are stated (image width = image height):
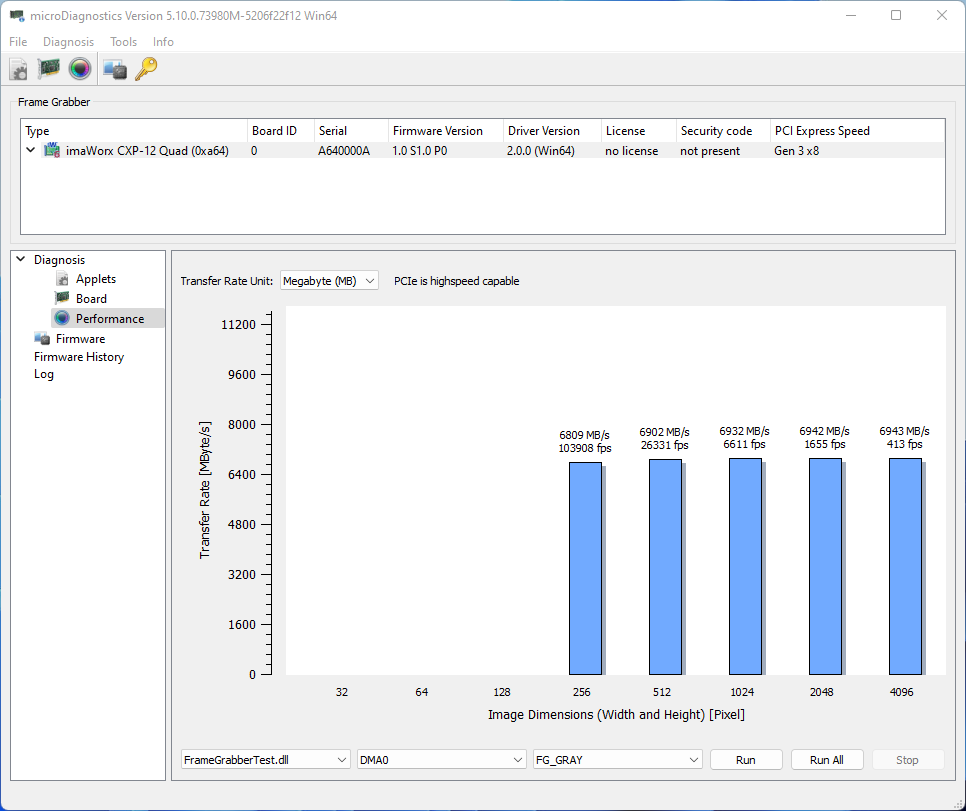
The results will always be applet throughput max. bandwidth.
You can run the performance test for all applets designed for your frame grabber.
Info
To find out about the maximum bandwidth of the frame grabber without regard to any applet specifics, use the Frame Grabber Test Applet (FrameGrabberTest) for testing the performance. The results inform you about the full frame grabber bandwidth available under the specific conditions (like PCIe generation provided by PCIe slot, available PCIe lanes, etc.).
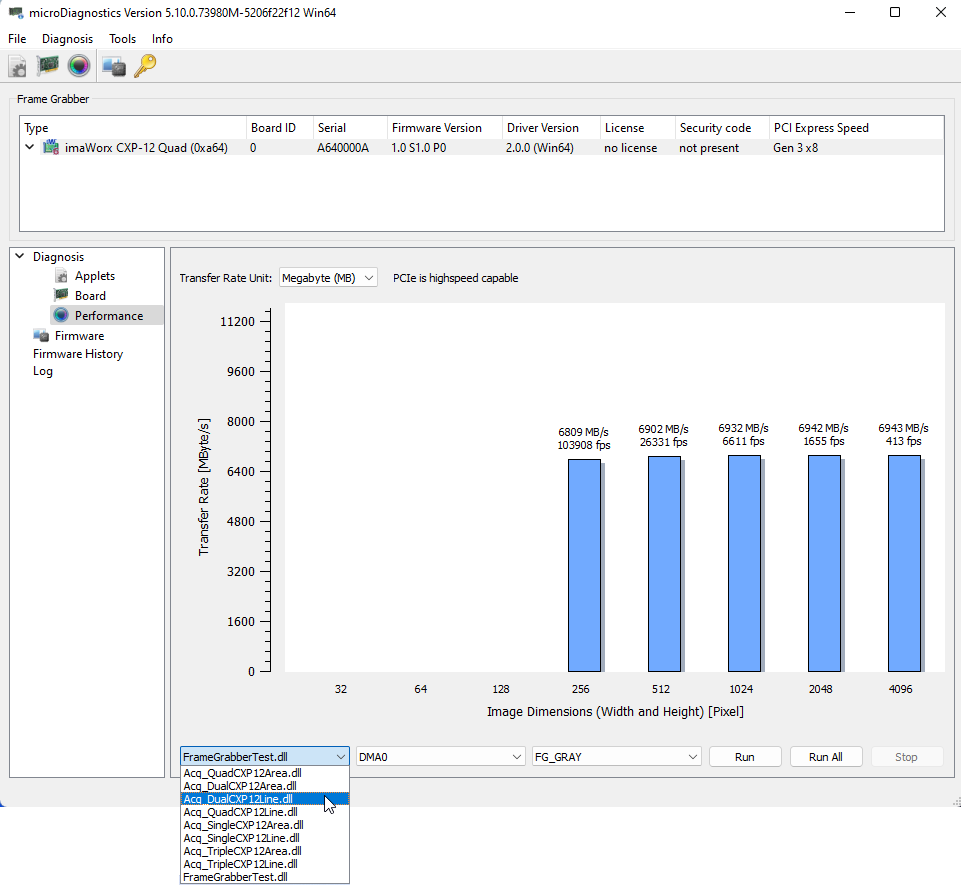
To test the performance with another applet:
- Select the applet you want to test on from the drop down list in the bottom area of the program window.
-
Repeat the performance test by selecting Diagnosis->Performance.
To get information about the DMA bandwidth:
- Select the board you want to test.
- Start the performance test by selecting Diagnosis -> Performance.
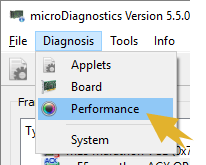
The performance test starts immediately. The results of the performance test are displayed:
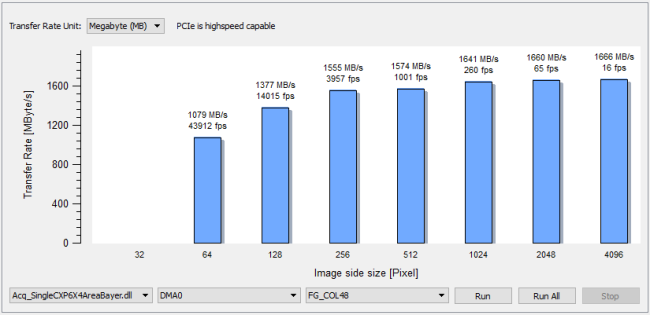
If you want to test the performance with another applet:
marathon Frame Grabbers#
On marathon frame grabbers, the performance test is carried out for the applet that is the currently active applet on the frame grabber.
To set a new applet to be the active applet:
-
From the menu, select Tools -> Manage Firmware/Applet(s).

All applets flashed onto the board are listed. The applet currently active on the board is marked by a small tick on green background:

-
Right-click on the line that lists the applet you want to test.
-
From the context menu, select Activate Now.

-
Follow the instructions on the screen.
For more details on setting an applet active, see Managing Applets.
System Test#
With the system test, you can get information about your computer system.
To start the system test:
-
Select Diagnosis -> System.
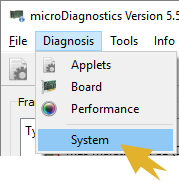
-
microDiagnostics now calls on another tool (CPU-Z). If you agree to use CPU-Z, confirm the message that pops up.
Comprehensive information about your computer system is displayed immediately in a new window: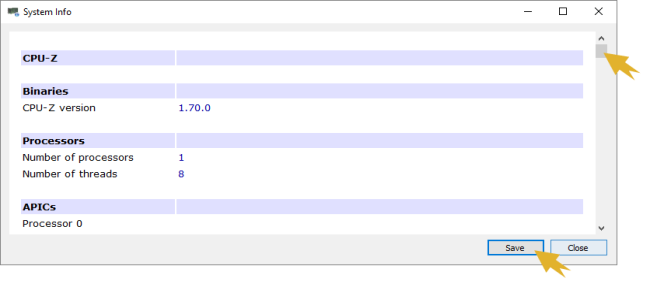
-
Use the scroll bar to scroll through the information.
- If you want to save the information, click the Save button.