Examining Images#
Overview#

Tips for Examining Images
- Use the mouse wheel to zoom in or out.
- Move the image in the DMA output display pane by dragging.
- Saving last frame / last sequence: Use the buttons in the right bottom corner to save an acquired sequence or the last acquired frame.
- Displaying pixel values: Zoom in to 32:1 or 64:1 and click the Display Pixel Value button. The pixel value is displayed directly on the pixel field. Use the Hex button to change value display from decimal to hexadecimal and vice versa.
- You can also open and save image files with the iolibrt. You find information about supported image formats and how these image formats are saved in the Working with Image Files section.
Buffer Information#

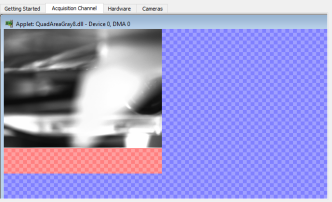
The background of the DMA Output Display pane informs you in case you don't use buffer space you have allocated:
- Blue background has no meaning.
- Red background: Invalid Data. There is buffer allocated, but not used because the frame of the acquired image is smaller than the buffer allocated via applet parameters ROI width and Height.
Make sure the ROI dimensions in your applet (DMA) configuration don't exceed the dimensions of the images acquired by the camera.
If ROI is bigger, invalid data are acquired and - in microDisplay X - displayed in red.
Line Profile#
The Line Profile tool allows you to examine the pixel values of a specific line in your image.
To use the tool:
-
Click the Line Profile button (right bottom corner in DMA output display pane) to open the Line Profile dialog.

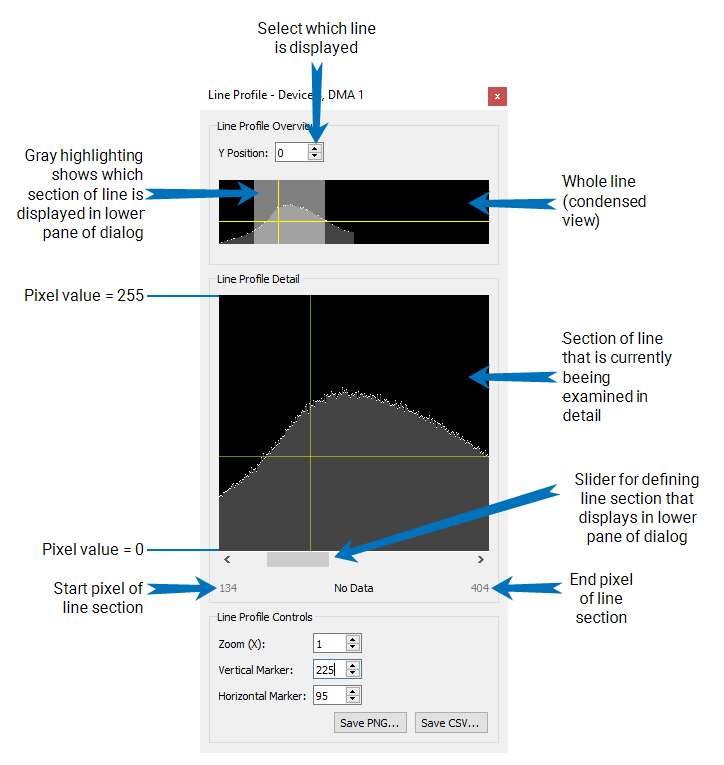
The dialog opens:

The line profile presents the pixel values of a line (condensed view in upper pane) and of a line fraction (view 1:1 in lower pane).
-
Select the line you want to examine in the Y Position box.
- Use the slider to select the part of the line you want to see in detail.
-
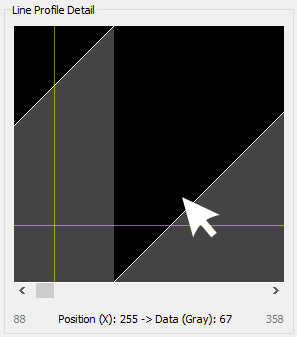
Use the mouse pointer to get information on an individual pixel. Mouse over the lower display (horizontal direction) to get the pixel position within the line and the gray/color value this pixel has.

-
Use the line profile controls in the bottom part of the dialog to vary the display of the line:
- Zooming in: The line fraction you are inspecting gets smaller. You see the color values of a smaller number of line pixels in the lower display. In the upper display, you see that the gray highlighted line section gets smaller. Benefit: The value for each examined pixel is better visible.
- Zooming out: The line fraction you are inspecting gets bigger. You see the color values of a greater number of line pixels in the lower display. In the upper display, you see that the gray highlighted line section gets broader. Benefit: You get values for a bigger section of the inspected line.
- Vertical marker: Entering a value for the vertical marker allows you to highlight a specific X position (a specific pixel) of the line. This allows you to control how the color/gray values behave before or after a specific pixel in the line.
- Horizontal marker: Entering a value for the horizontal marker allows you to highlight a specific color/gray value in the display. This makes it easy for you to control your success if you don't want to achieve image pixels above or below a specific value. You can adapt your system accordingly (lighting, configurations) and check in the line profile if the result matches your requirements.
Line Histogram#
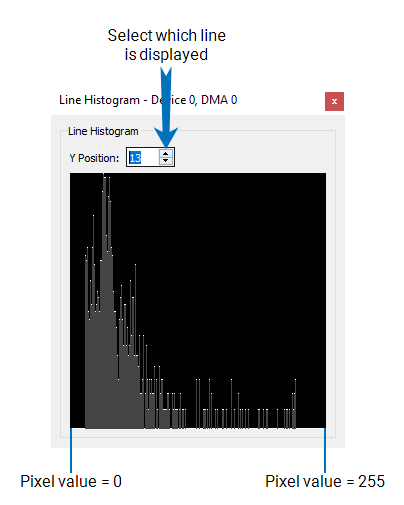
The Line Histogram tool shows you how often a specific pixel value is used in the selected line.
To use the tool:
-
Click the Line Histogram button (right bottom corner in DMA output display pane) to open the Line Histogram dialog.

The dialog opens:

In the example line above, there are no pixels of pure black (= 0) or pure white (= 255) color. You can see that darker gray values dominate the line.
-
Select the line you want to examine in the Y Position box.